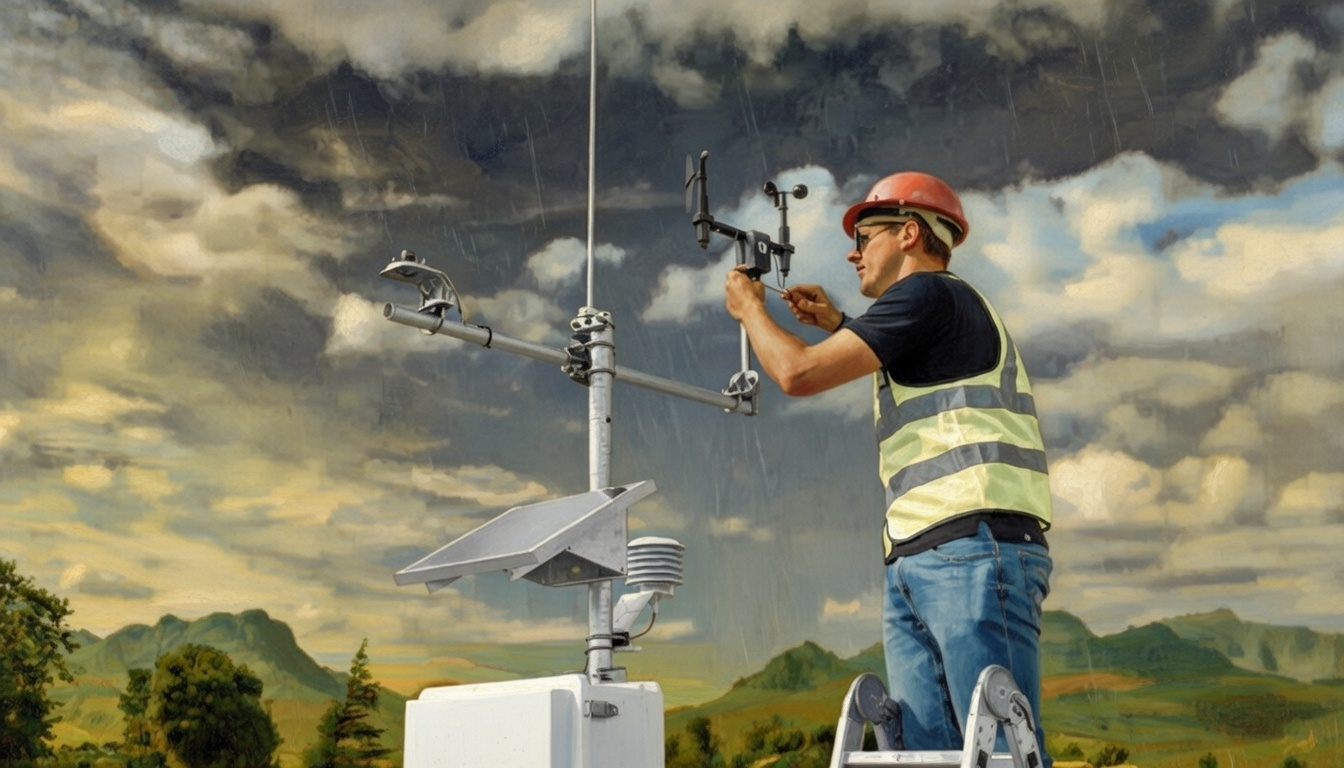
WXLOG WEATHER MODIFICATION →
Analysis Dashboard
Cloud seeding seedability assessment, regression analysis, and real-time atmospheric data visualization
Sample Data Analysis
WxLog V1 Demo • Cloud Seeding Evaluation Software
Total Days
365
Seeded Days
89
Mean Target
4.2mm
Mean Control
3.1mm
TITAN Cells
200
Seeded Cells
80
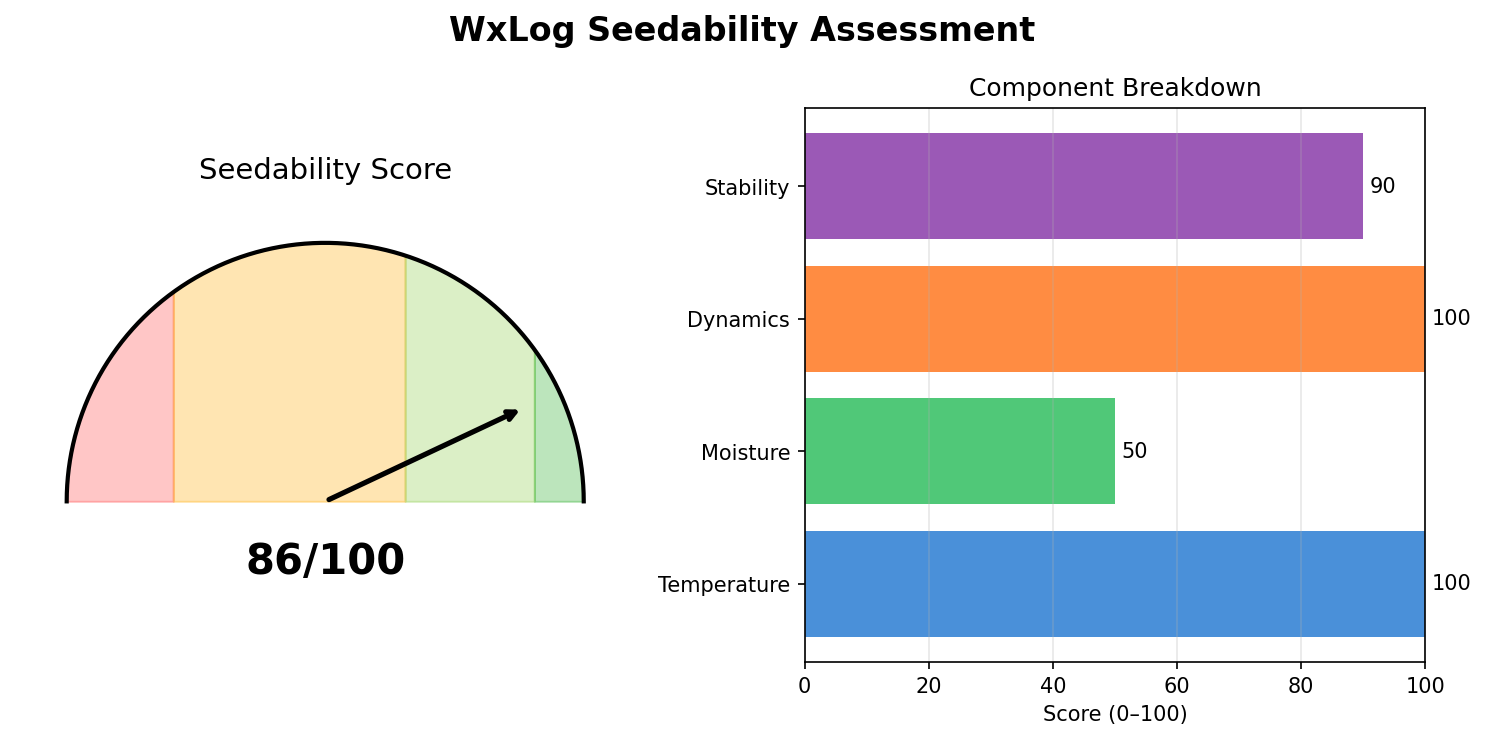
Seedability Assessment
MODERATE SEEDABILITY
Score
58/100
Confidence
85%
Cloud Type
Cumulus
Agent
AgI
Statistical Analysis Plots
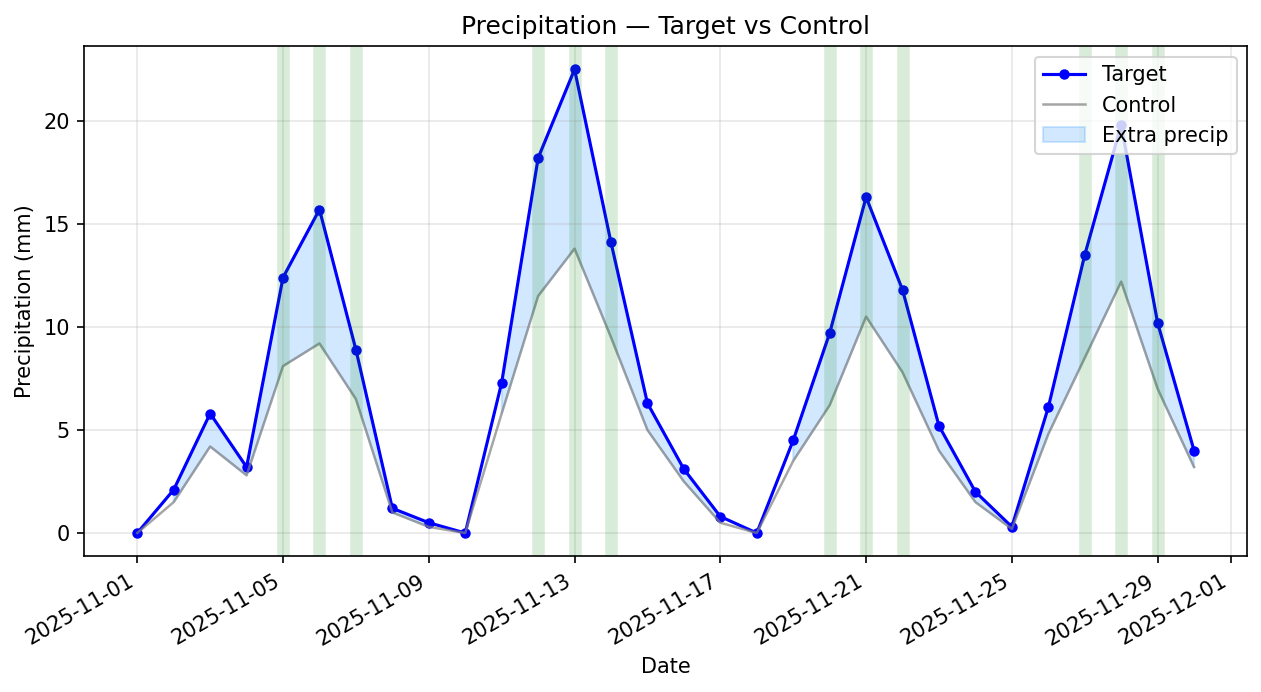
Precipitation Time Series
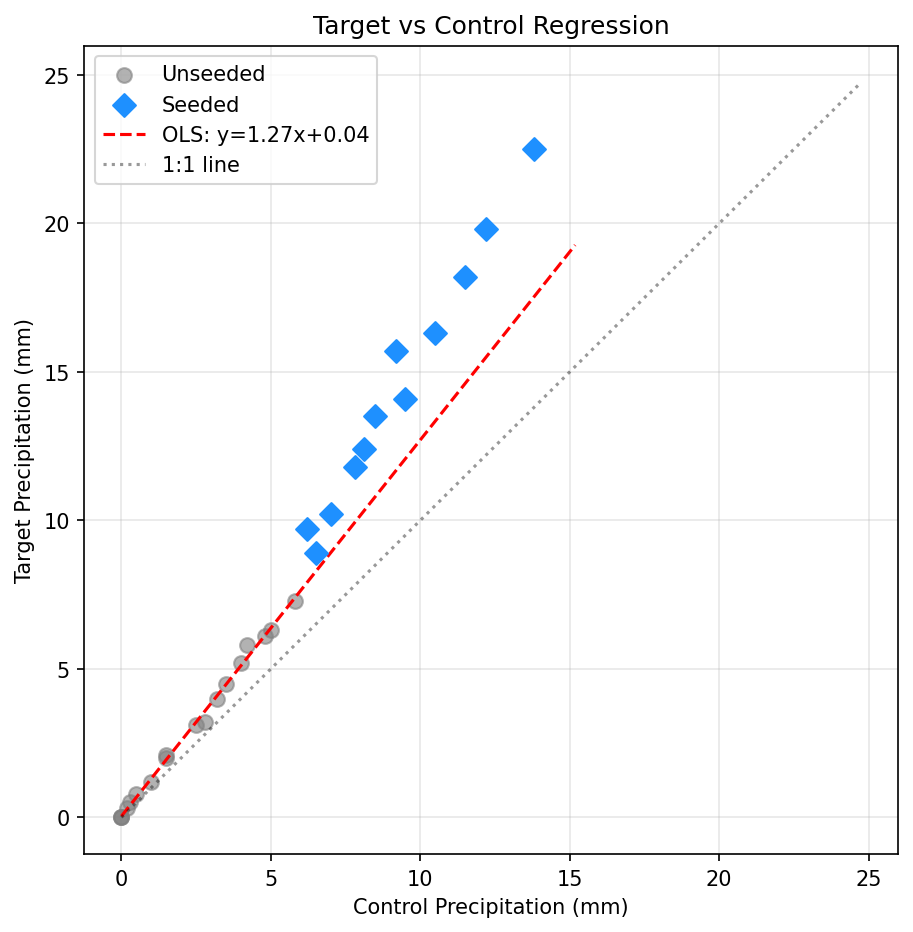
Target vs Control Scatter
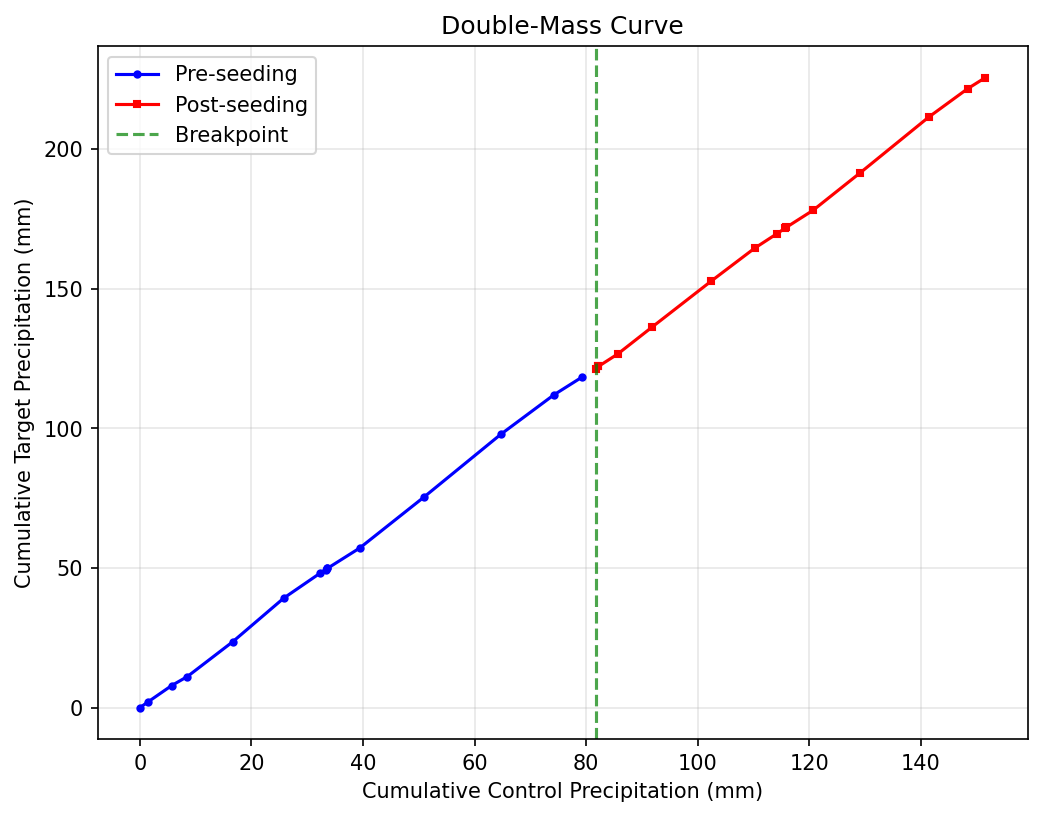
Double-Mass Curve
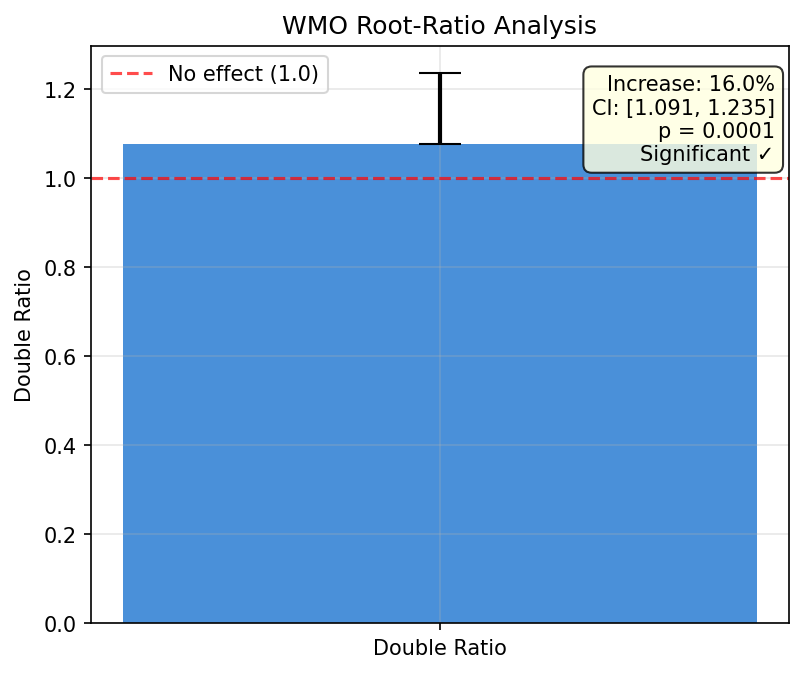
WMO Root-Ratio Analysis
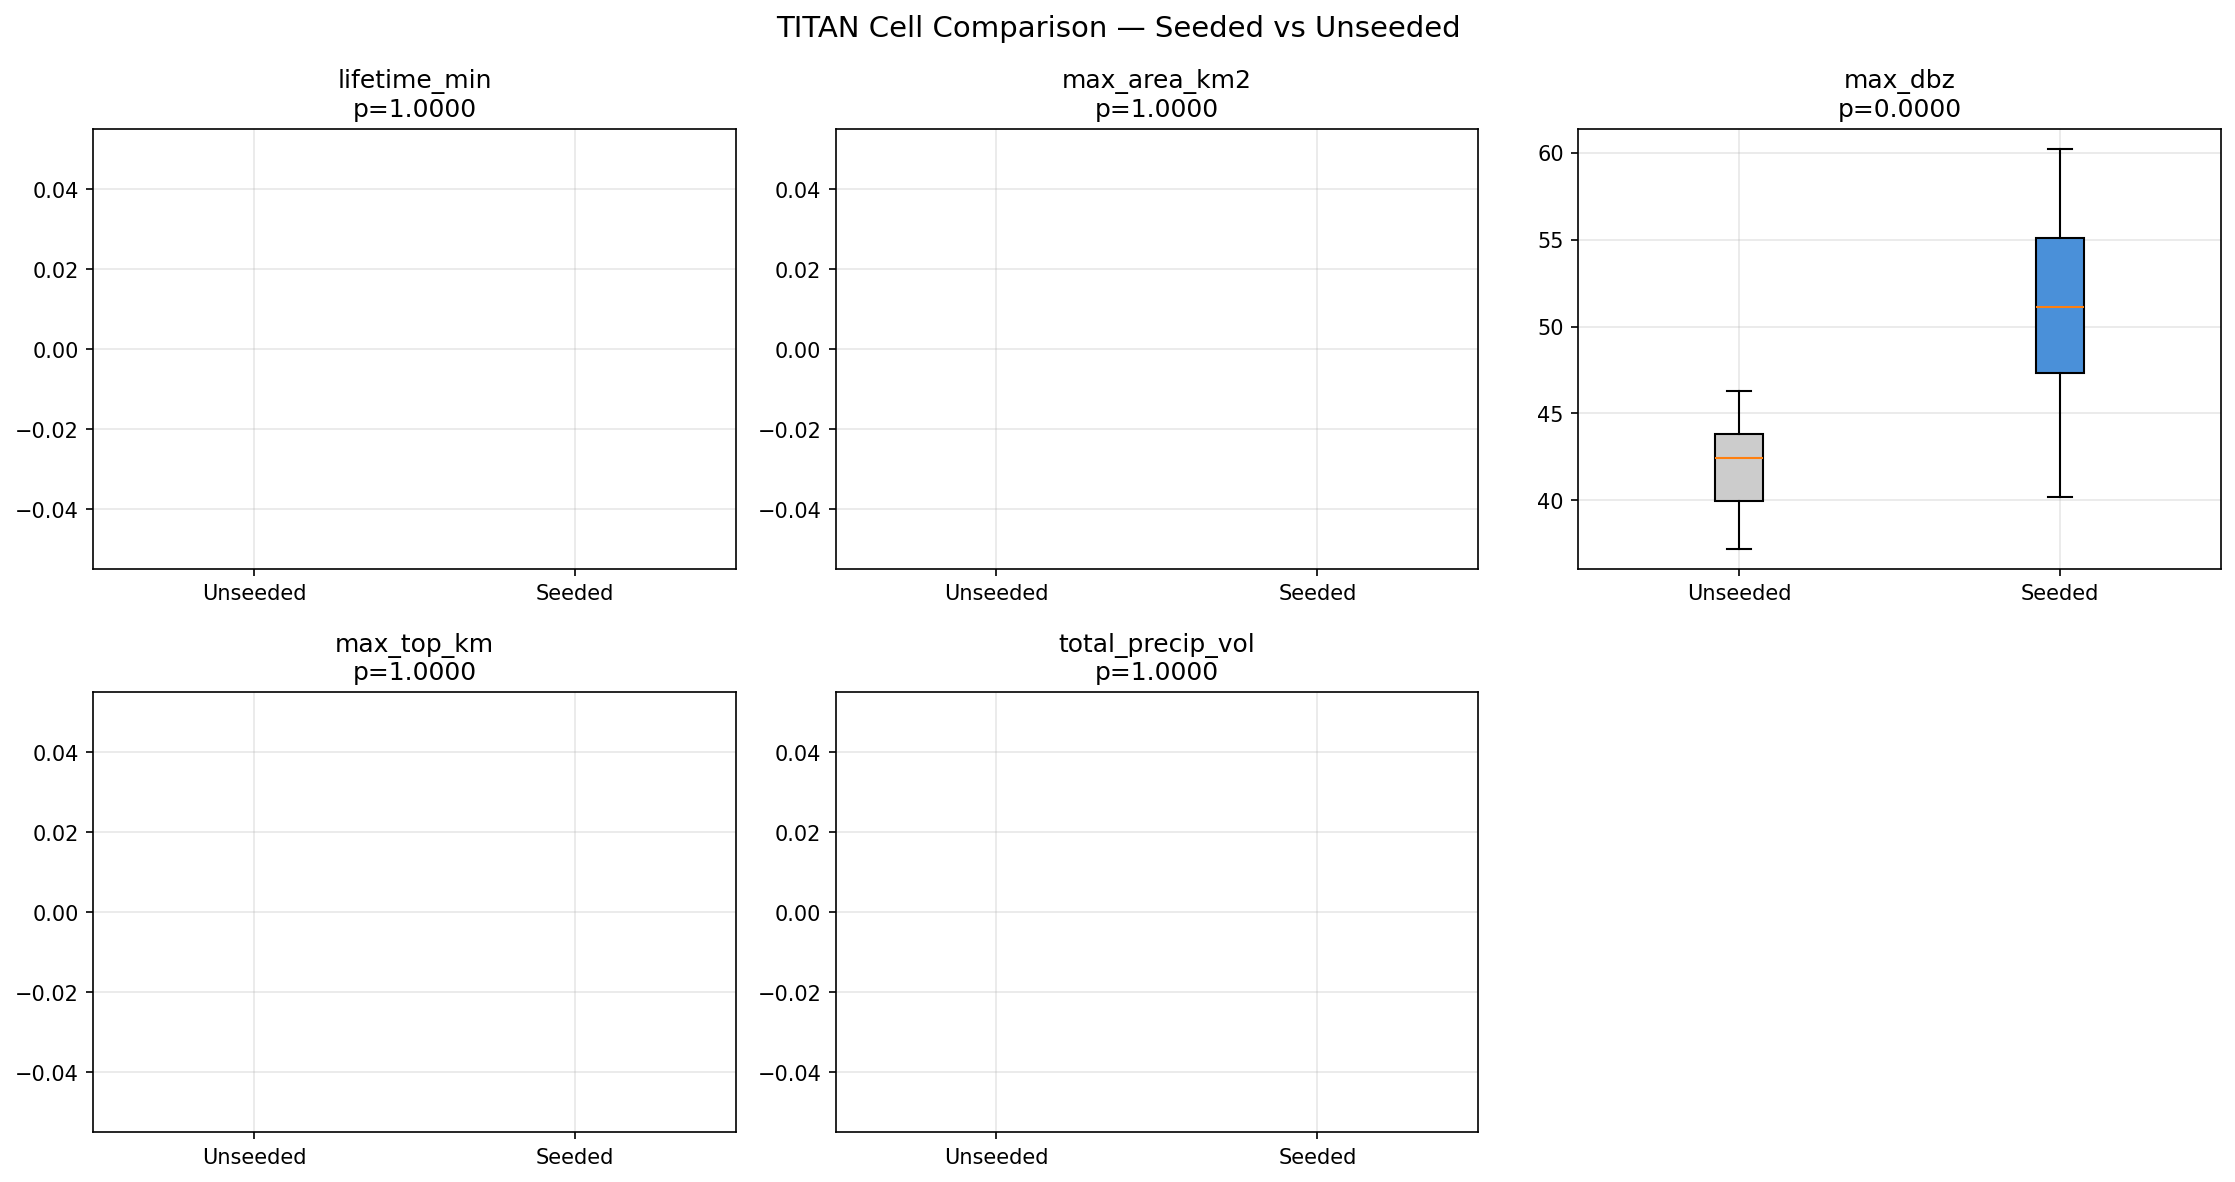
TITAN Cell Comparison
Programme Efficacy Metrics
Area Ratio
1.35
Root Ratio
1.16
Relative Effect
+35%
T-Statistic
2.847
Bootstrap CI
[1.08, 1.24]
WMO Compliance
✓ Pass
Seasonal Analysis
Summer (DJF)
+22.1%
Autumn (MAM)
+15.8%
Winter (JJA)
+8.2%
Spring (SON)
+24.6%
Peak Season
Spring
Annual Effect
+18.4%
TITAN Cell Statistics
Total Cells Tracked
200
Seeded Cells
80
Control Cells
120
Mean Seeded Duration
42 min
Mean Control Duration
31 min
Duration Increase
+35.5%
OLS Regression Results
Precipitation Increase
18.4%
95% CI Lower
8.2%
95% CI Upper
29.1%
Extra Precip
127.5 mm
Economic Value
$331,500
Significant
✓ Yes
Double-Mass Curve Analysis
Slope Before
0.8142
Slope After
0.9618
Change
+18.1%
p-value
0.0023
Breakpoint
2024-06-15
Significant
✓ Yes