WindRose V1 loads CSV, Campbell Scientific TOA5 logger files, NOAA
ISD-Lite and ISCST3 surface data, then produces publication quality
wind roses, time series charts, circular
statistics, Weibull energy yield screening,
pollution roses with CPF source apportionment,
and Gaussian plume air quality dispersion. A
command line engine drives batch automation.
How it works
You point WindRose V1 at a data file and map the wind speed, direction and
(optionally) a concentration or timestamp column. The engine cleans and
validates the record, bins the observations into direction sectors and speed
classes, and computes the statistics below. Results render on screen and
export to a range of formats for reports, presentations and mapping. The same
engine runs from the command line, so an operator can regenerate an entire
set of roses and reports on a schedule.
The WindRose V1 desktop application
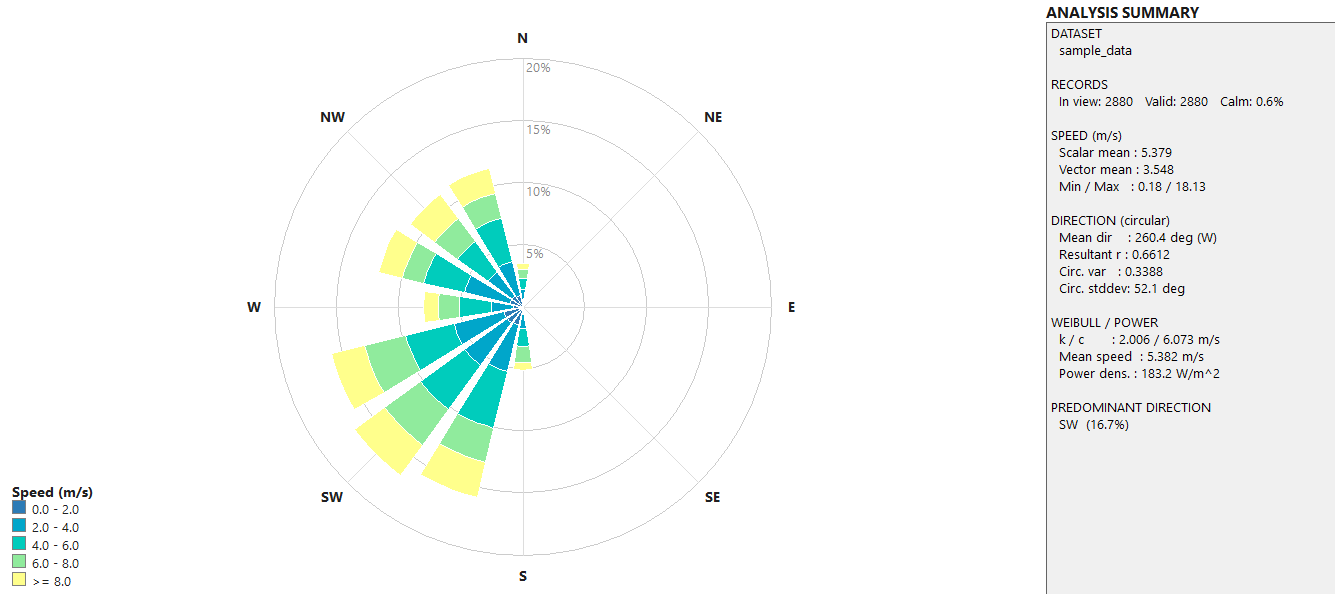
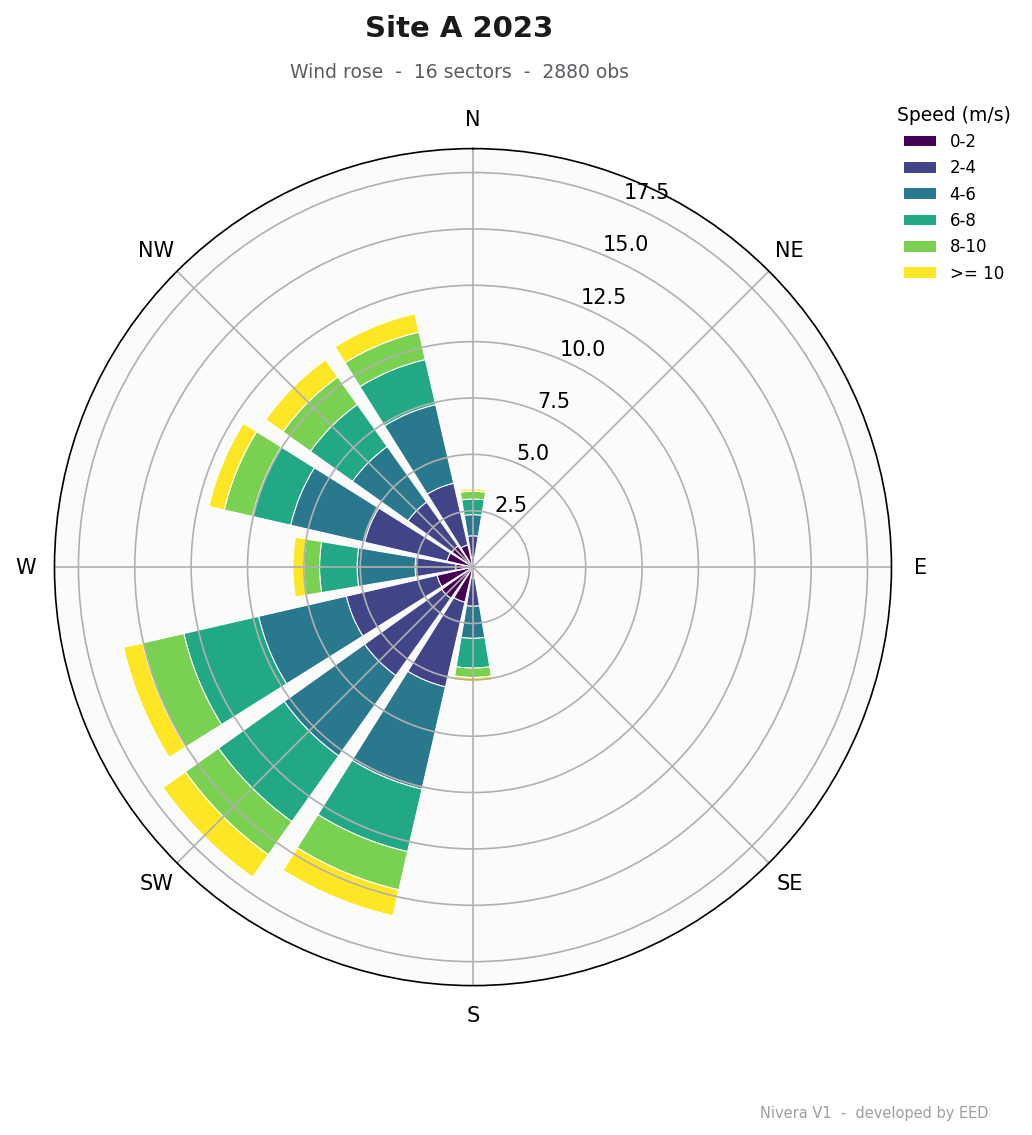
[ Wind rose ]
Wind rose with 4, 8, 16 or 36 sectors, configurable speed classes and calm threshold, with a predominant direction summary.
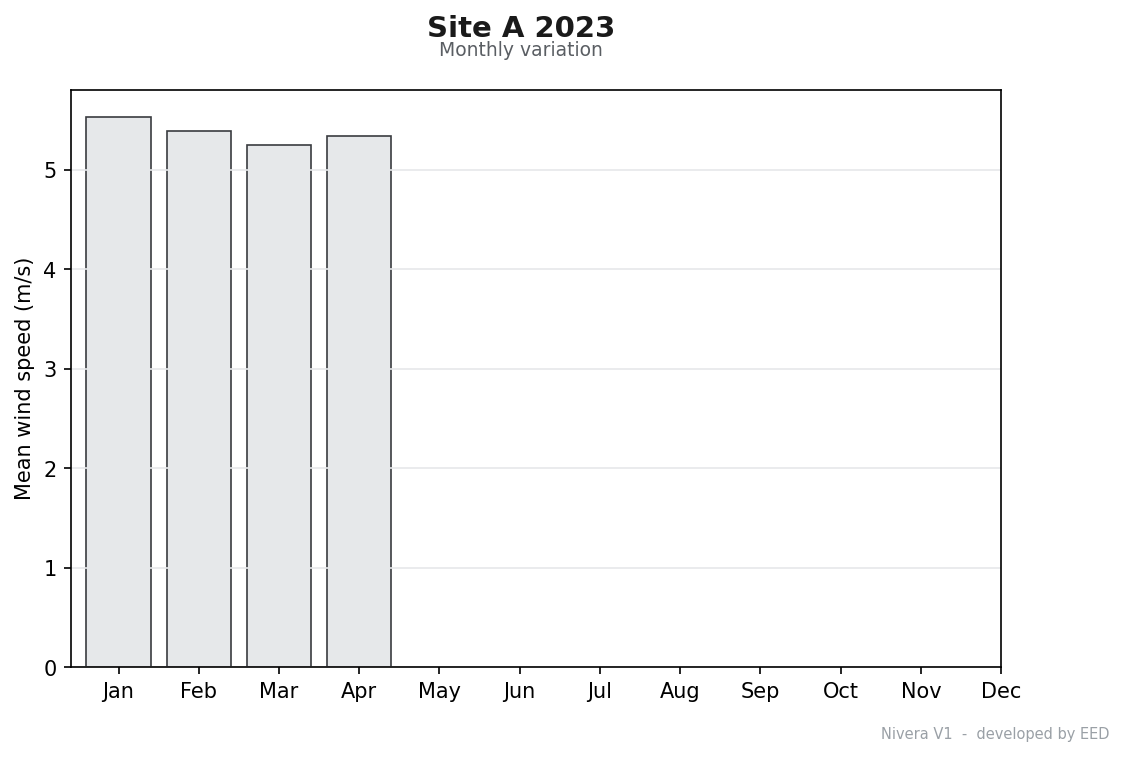
[ Time series ]
Time series line charts (speed, direction or both) with auto scaling axes over a selectable one day to ten year window.
[ Statistics ]
Scalar and vector mean speed, mean direction, resultant length, circular variance and standard deviation.
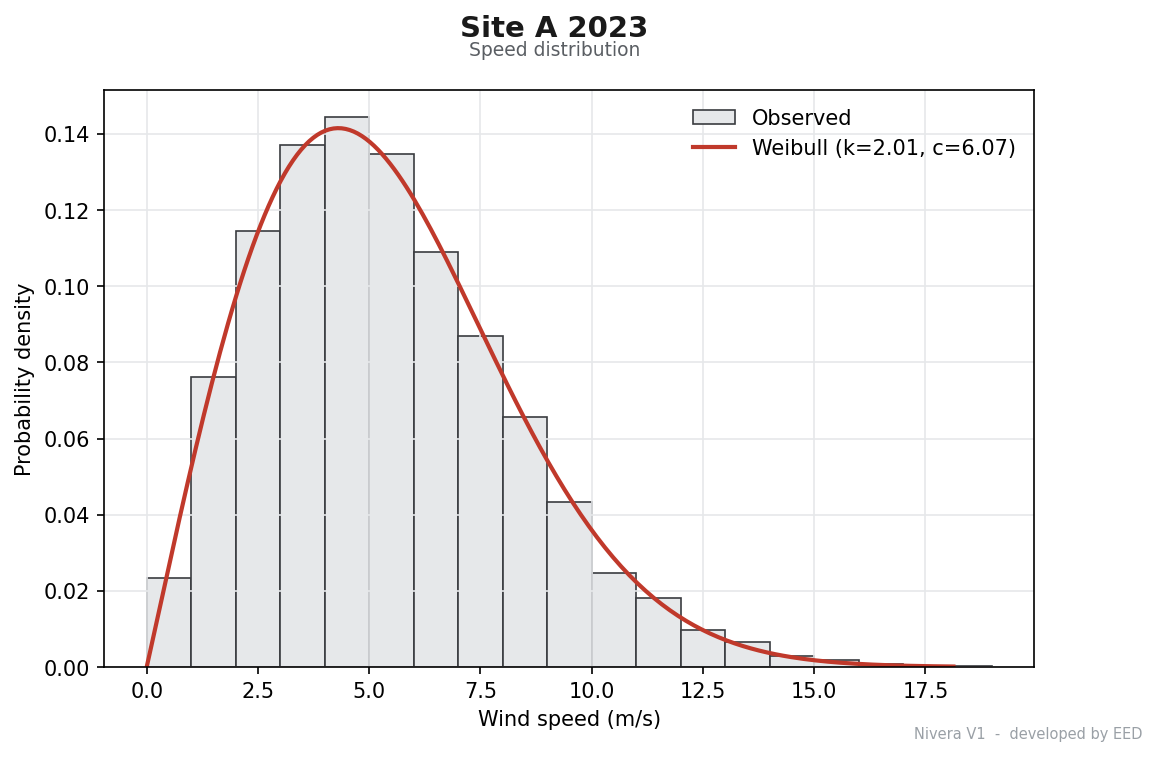
[ Wind energy ]
Weibull shape k and scale c, wind power density in watt per square metre, and turbine annual energy production (AEP) and capacity factor.
[ Air quality ]
Pollution rose and Conditional Probability Function (CPF) source apportionment, plus Gaussian plume dispersion with Pasquill-Gifford stability classes A to F.
[ Animation ]
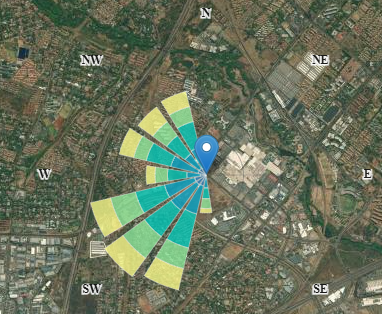
Animated wind rose over time, standalone or over a street or satellite map.
[ Export ]
PNG, SVG, multi page PDF report, KML for Google Earth, interactive map, animated HTML and GIF, CSV and HTML.
[ Automation ]
Command line engine for scripted batch runs and workflow integration.
[ Display ]
Selectable speed units (metre per second or knots), rose orientation (blowing from, or flow vector blowing to), proportional or uniform equal-area petals, and zoom on the rose and charts.
[ Sectors ]
4, 8, 16, 32 (mariner) or 36 direction sectors, with fully custom speed-class edges.
[ Met data ]
Met data information panel, frequency count and frequency distribution tables, and a wind class frequency distribution chart.
Sample output
Nivera Test Site · wind roseSpeed distribution and Weibull fitTestbed Station 04 · monthly meanWind rose over a satellite map
Who uses it
Wind energy developers screening a site before committing to a met mast,
environmental and air quality consultants building pollution roses and
dispersion estimates, aviation and runway studies needing crosswind analysis,
and researchers who want repeatable, publication quality figures from raw
logger data.
Add-on: WindRose for Excel
WindRose for Excel is a separate downloadable Microsoft Excel add-in for
wind data analysts, sold apart from the desktop application. It reads ASCII
data produced by any datalogger, LIDAR or SODAR and writes the analysis
straight into Excel worksheets. It accepts time series with different time
steps (for example 10 minute, hourly or 3 hourly) and can output the
concurrent dataset as a single table.
[ Analysis ]
Classic wind data analysis: mean values and gusts, time and energy wind roses, Weibull distribution, air density corrections and one hour autocorrelations.
Diurnal distributions (global or per month) for wind speed or shear, and representative or characteristic turbulence intensity tables.
Capacity factor and annual energy production of a wind turbine at the measurement location, with wind shear and veer investigation and raw data visualisation with zoom.
[ Standards ]
Analysis methods align with the wind energy standards IEC 61400-1 and IEC 61400-12 and MEASNET site assessment, including in-situ anemometer calibration (Annex K of IEC 61400-12).
[ Correlations ]
Site correlations by the MCP matrix method for two concurrent sites: the time shift that maximises wind speed correlation, and correlation and regression coefficients per direction sector and wind speed bin.
Predicted time series for filling data gaps, linear and polar plots of wind speed ratios, turbulence intensity correlations, and easy location of periods with high or low correlation.
WindRose for Excel is sold separately from the desktop application. Contact us for more information on the add-in, its data requirements and licensing.
Specifications
Data import
CSV, TSV and whitespace text (auto detected columns), Campbell Scientific TOA5, NOAA ISD-Lite, ISCST3 surface meteorology.
Wind rose
4, 8, 16, 32 (mariner) or 36 direction sectors; custom speed classes; calm threshold; predominant direction summary.
Units and display
Speed in metre per second or knots; orientation blowing from or flow vector; proportional or uniform equal-area petals; zoom on rose and charts.
Met data tools
Met data information panel, frequency count and frequency distribution tables, and a wind class frequency distribution chart.
Statistics
Scalar and vector mean speed, mean direction, resultant length, circular variance and standard deviation.
Energy
Weibull k and c (maximum likelihood), power density in W/m2, turbine AEP and capacity factor.