Data Acquisition Systems and Services
| Environmental and atmospheric | Complete weather station systems, air quality and emissions sensors, soil moisture and temperature arrays, and remote solar powered stations for research and climate data. |
|---|---|
| Industrial process intelligence | Robust acquisition for manufacturing, mining and energy: high frequency vibration analysis, temperature and pressure monitoring, emissions tracking and SCADA integration. |
| Agricultural and precision farming | Crop monitoring sensors, irrigation management, farm weather stations and grain storage monitoring for data driven decisions. |
| Custom dataloggers | SDI-12, RS232 and RS485 sensor support; LoRaWAN and 4G LTE connectivity; 5V and 12V at 3A power output; micro SD storage; built for demanding field deployments. |
| Services | Consulting, project management, PCB design, custom software development, and long term support from a local team. |
Designed, Built and Deployed
Real systems we have engineered and delivered for clients across demanding operational environments, from concept through PCB design to field deployment.
SigFox Load Cell Balance Monitoring
Ultra low power wireless load cell junction boxes on the SigFox LPWAN network for remote mass balance monitoring, with solar charging and 24-bit ADC precision. Ideal for silo inventory, water tank levels and industrial weighing.
SigFox LPWAN24-bit ADCSolar PoweredRadar Rain Gauges with Custom Loggers
Custom dataloggers paired with radar precipitation sensors for high resolution rainfall measurement, with real time signal processing, local storage and multi protocol telemetry. Research grade data without tipping bucket maintenance.
Radar SensingCustom LoggerResearch GradeSatellite Trackers for Livestock
GPS/GNSS satellite tracking units for livestock on large farms and conservancies, with rugged enclosures, long life battery management and satellite uplink for zero cellular coverage. Real time herd location, geofencing and movement analysis.
GPS/GNSSSatellite UplinkGeofencingGeophysical Spectrometer
Custom multi channel geophysical spectrometer for subsurface characterisation and mineral analysis, with high resolution spectral acquisition, configurable detector arrays and a field portable enclosure for geological surveys and exploration.
Spectral AnalysisGeophysicsField PortableCustom Multi-Channel Data Loggers
Versatile in house dataloggers supporting analog (4-20mA, 0-10V), digital (SDI-12, RS-485) and pulse inputs, with industrial grade components, onboard storage and configurable sampling for research and industrial monitoring.
Multi-ChannelSDI-12 / RS-485Industrial GradeSilo Monitoring Sensors
Silo inventory monitoring using laser time of flight level measurement, load cells and temperature probes, with LoRa, GSM and Sigfox telemetry and a cloud dashboard for continuous stock visibility and logistics optimisation.
Laser ToF LevelLoRa / GSM / SigfoxCloud DashboardScientific Software
|
WindRose V1
Wind rose, energy yield and air quality analysis. Platform Licensing Brochure available on request |
WindRose V1 loads CSV, Campbell Scientific TOA5 logger files, NOAA ISD-Lite and ISCST3 surface data, then produces publication quality wind roses, time series charts, circular statistics, Weibull energy yield screening, pollution roses with CPF source apportionment, and Gaussian plume air quality dispersion. A command line engine drives batch automation.
Sample output 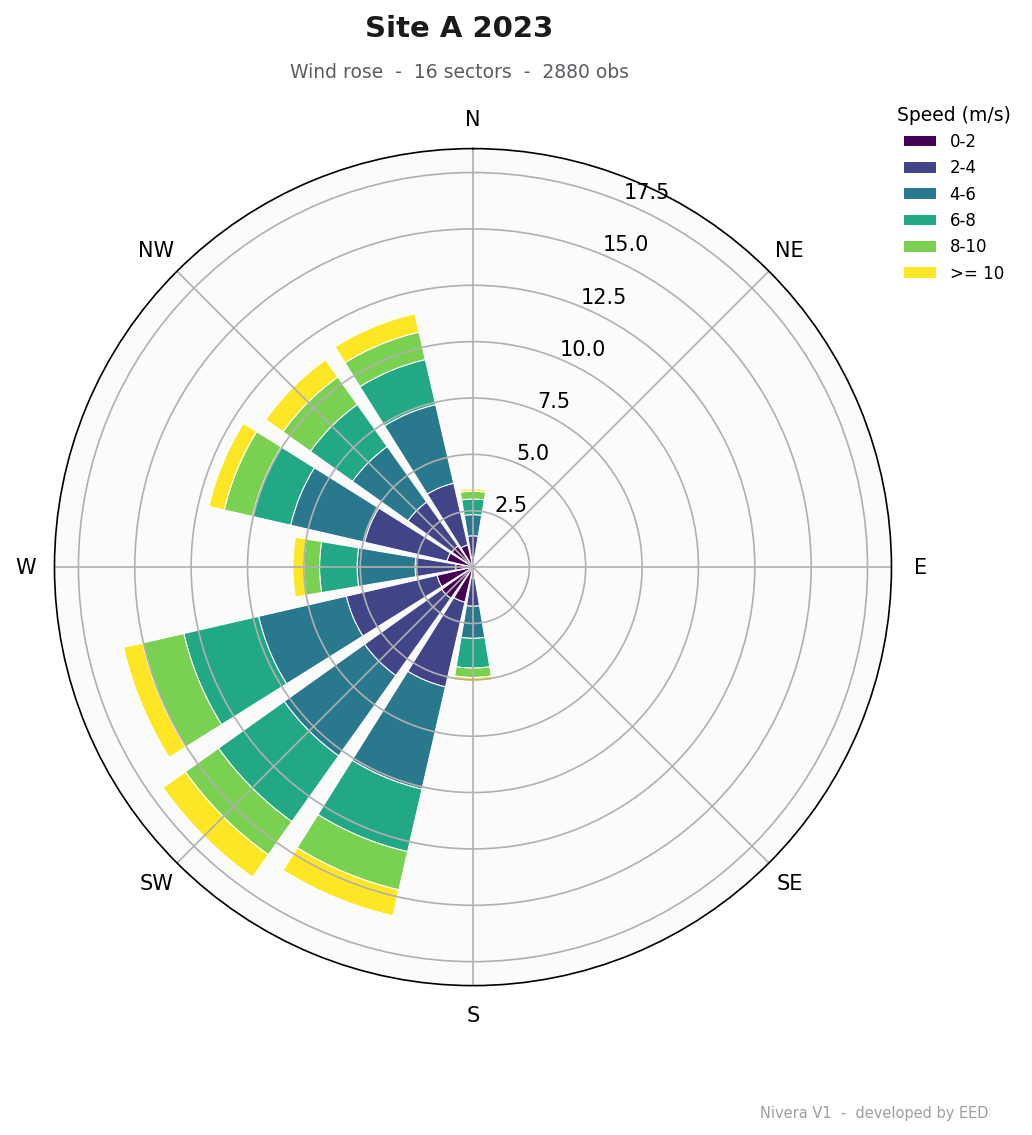 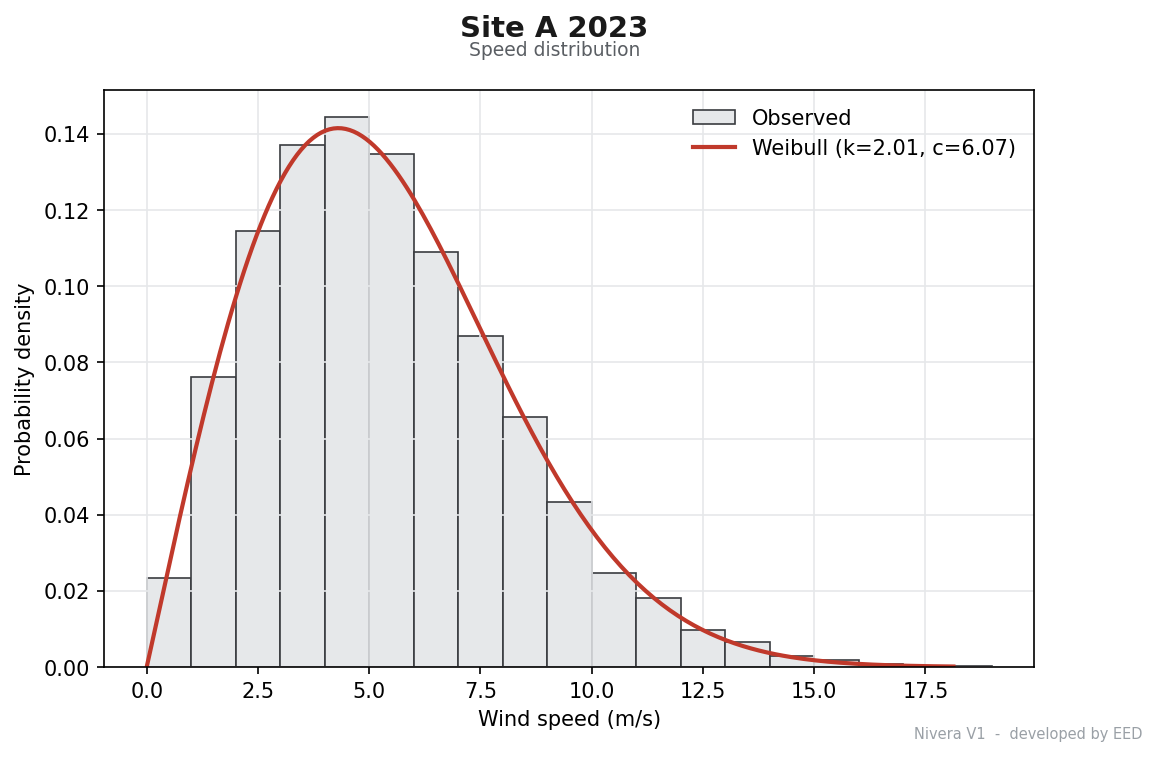 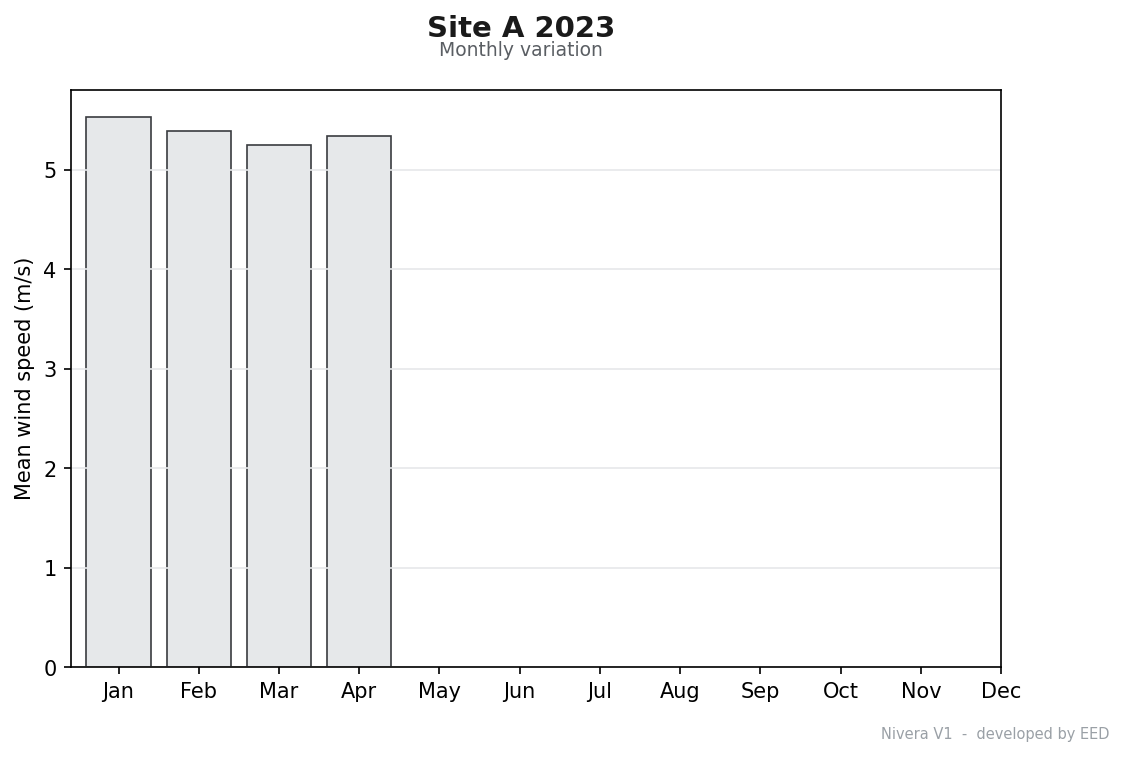 |
|
WxLog V1
Cloud seeding (weather modification) evaluation and optimisation. Platform Licensing Documentation on request |
WxLog V1 is an offline desktop application for post-operation evaluation and optimisation of cloud seeding programmes. It takes raw data (gauges, grids, radar, trajectories) through rigorous statistical analysis to publication quality PDF reports, answering whether seeding produced a statistically significant increase in precipitation and quantifying the additional water yield, with a zero knowledge privacy architecture.
Sample output 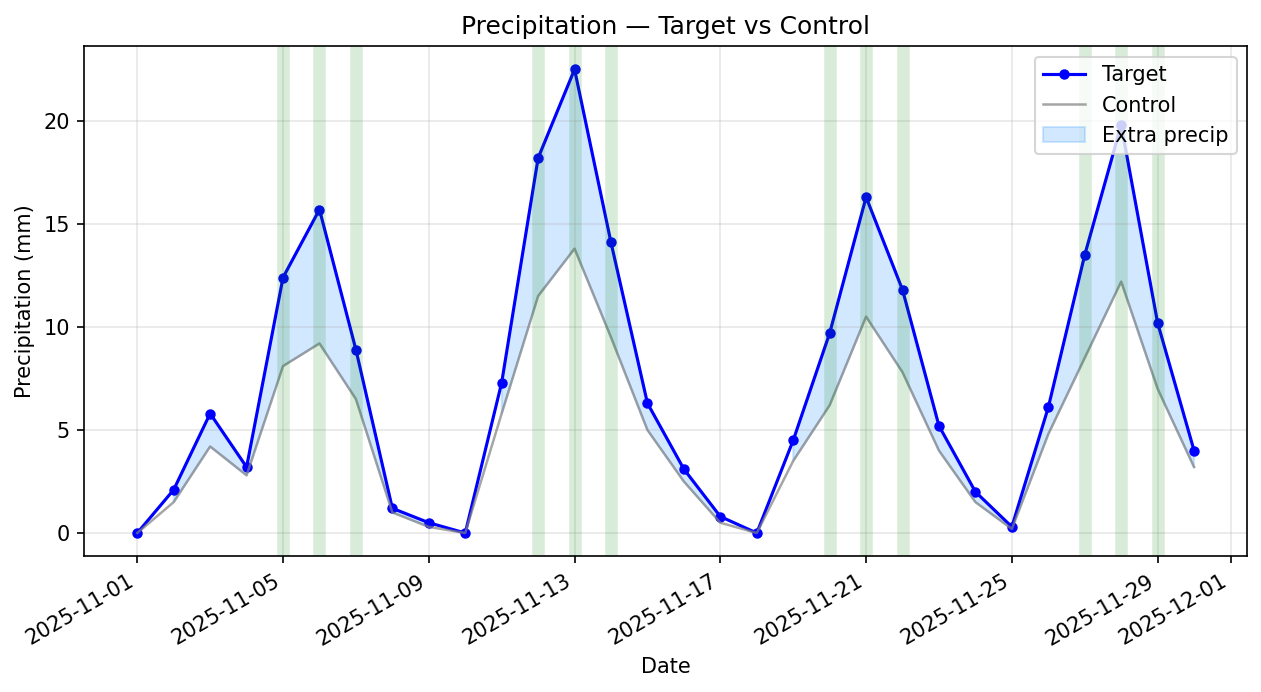 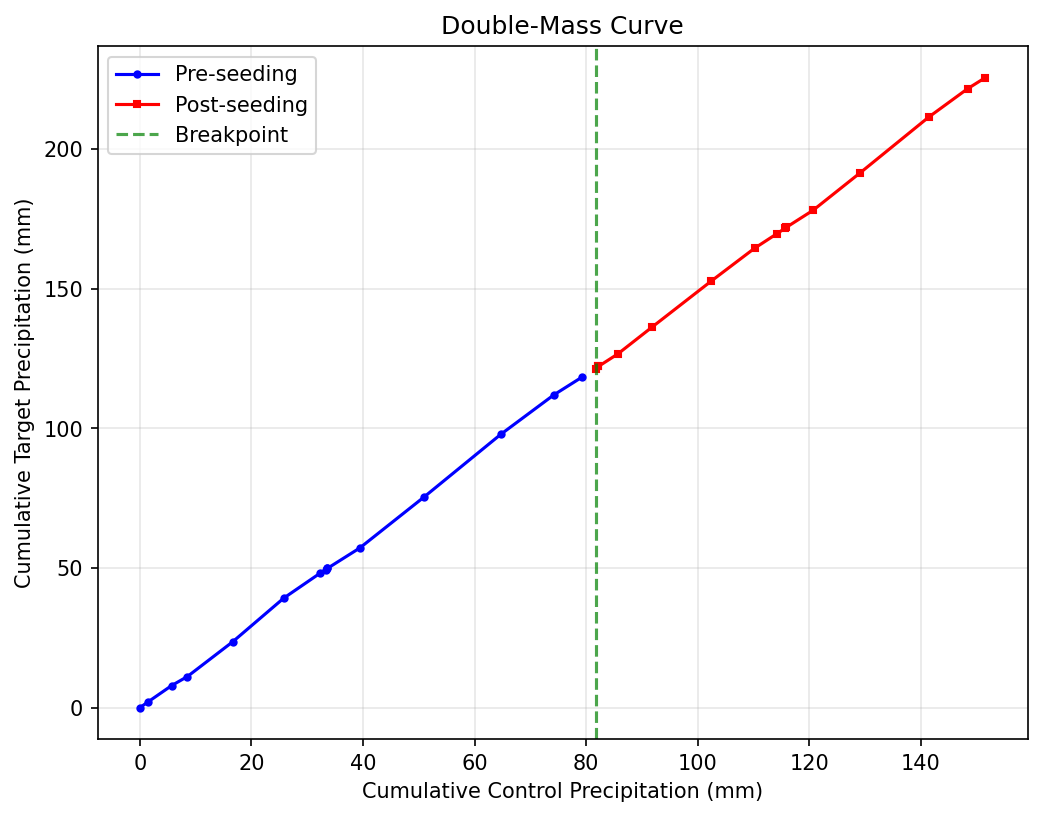 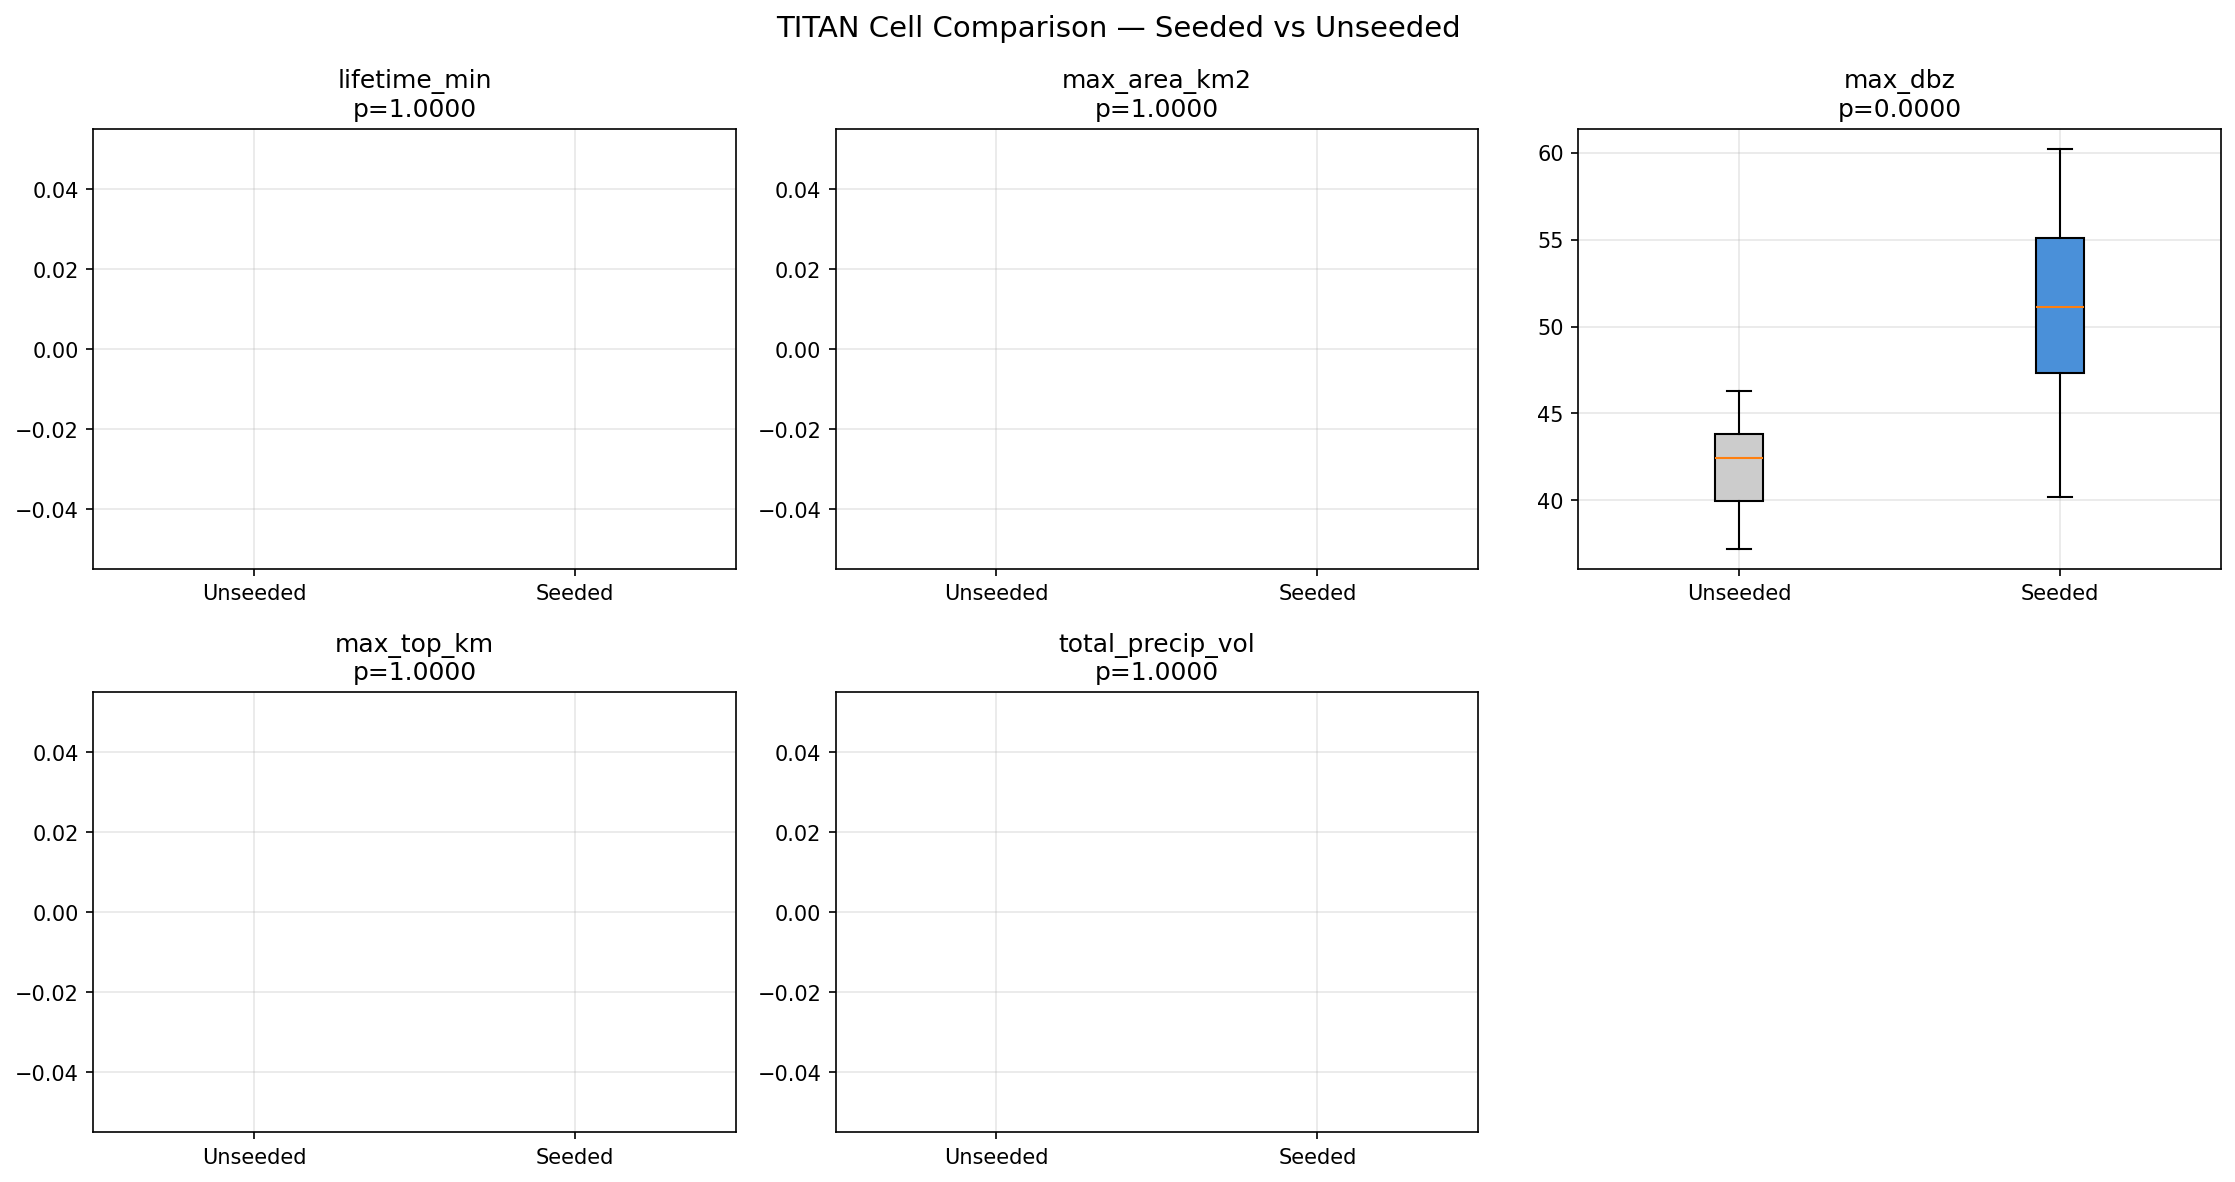 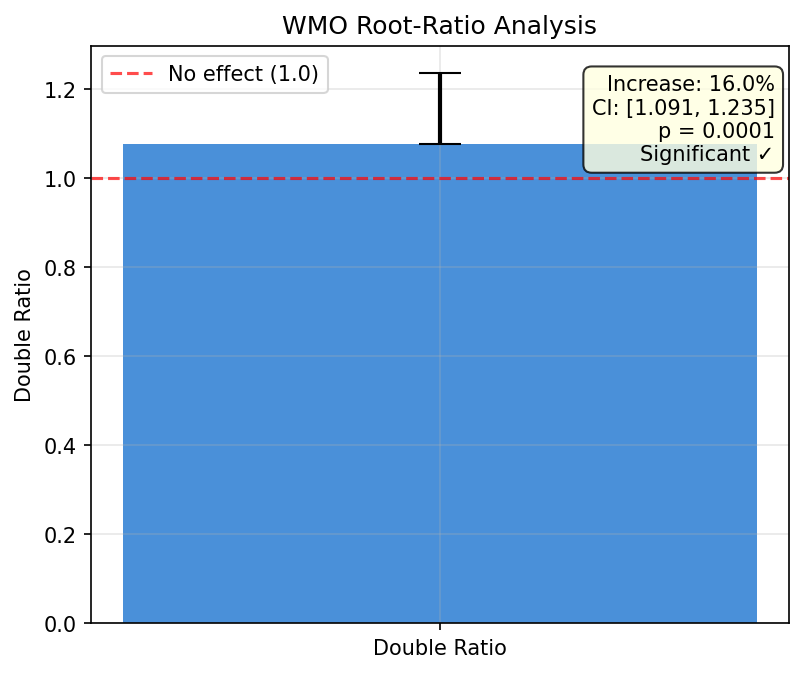 |
|
MetQuery V1
Multi-vendor weather station management and real time monitoring. Platform Licensing Brochure available on request |
MetQuery V1 is a multi-vendor web application for managing weather stations, collecting data and monitoring conditions in real time. It connects to Campbell Scientific dataloggers and a range of IoT and cloud platforms through a unified protocol manager, then turns raw observations into rich meteorological, agricultural, aviation, fire risk and wind energy analytics.
|
Contact
Email
lab1@estreuxtechnologies.co.za
Location
Lindequesdrif
North West Province
South Africa
Near
Potchefstroom, on the banks of the Vaal River
Copyright 2026 EED Data Systems (Estreux Electronic Development). All rights reserved. Validate results before regulatory or safety critical use.